One aspect of economic growth can be measured in personal income. Most of this study focuses on personal income growth in the United States of America from 1860 to 1900. Personal income is not the sole factor of economic growth, but it can be a useful indicator.[1] If individuals have higher incomes, then they generally have greater purchasing power. This is not always true, however. Within different regions of the country, certain items may cost more or less. The goal of this study is to measure and compare economic growth solely using personal income, while also discussing the limitations of this approach. Two tables comparing regional personal income and population are at the end of this essay.
The purpose of including estimated data from 1840 is to attempt to evaluate the economies of the Northeast and South (especially the South) before and after the Civil War. The following data shows that, though the South’s share of the national population declined slightly from about 37% in 1840 to 30% in 1900, its share of national personal income declined from 29% to 15%, roughly double its population decline.[2] Besides the destruction of the Civil War, what possible factors can account for slower economic growth in the South versus the Northeast (and other regions) in the country? To answer this question, the works of Robert A. Margo and Richard A. Easterlin will provide insight. Easterlin’s chapter in The Reinterpretation of American Economic History highlights personal income and population, while Margo’s scholarly work examines wage differentials between the North and the South.[3]
There are several factors involved in postbellum economic growth. There are other factors involved in the different paces of growth across the country’s postbellum geographical regions. The South had to recover as well as the North, but the North was already more industrialized and had a large immigrant source for industrial labor, so economic recovery occurred more rapidly there than in the South.[4] This is also true for other regions. Additionally, the South had to adjust its labor force with newly freed slaves and redevelop its already lagging infrastructure. For most of this discussion, the U.S. is divided into geographical regions. The “Northeast” refers to New England and Mid-Atlantic states: modern NJ, PA, NY, CT, RI, MA, NH, VT, and ME. The “North Central” relates to most of the Great Lakes states and western plains states: modern OH, IN, IL, MI, WI, MN, IA, MO, ND, SD, NE, and KS. The South includes South Atlantic states, non-Atlantic states, and states around and including Texas: modern MD, DE, WV, VA, NC, SC, GA, FL, KY, TN, MS, AL, OK, AR, LA, and TX. Finally, the “West” region includes mountain states and Pacific coast states: modern ID, MT, WY, NV, UT, CO, AZ, NM, WA, OR, and CA.
Different regions in the country had different proportions of the nation’s income. Population partially determines which region has a larger or smaller share of national income. For example, in 1840, individuals in the Northeast accounted for approximately 58% of the nation’s personal income, the North Central region for about 13%, and the South for about 29% of personal income.[5] At this point, about 43% of the population lived in the Northeast, about 20% lived in the North Central, and about 37% lived in the South.[6] The income difference between the Northeast and South regions is greater than their populations. It should be cautioned that Easterlin’s information regarding the year 1840 was based on estimates of commodity production and commodity distribution.[7]
Twenty years later, the population had shifted, and with it, the personal income distribution. In 1860, the Northeast accounted for about 50% of the nation’s personal income and 36% its population.[8] The North Central region accounted for about 20% of the nation’s personal income and about 29% of its population.[9] The South had about 26% of personal income and about 33% of the nation’s population.[10] The West had grown a little as well, with about 4% of the nation’s personal income and 2% of the nation’s population.[11]
Income changed another twenty years later. In 1880, the estimated personal income within the country was about 44% in the Northeast, 34% in the North Central, 15% in the South, and about 7% in the West.[12] The distribution of the nation’s population was about 31% in the Northeast, 35% in the North Central, 31% in the South, and 4% in the West.[13]By 1900, about 41% of the nation’s personal income was in the Northeast region, 36% was in the North Central region, 15% was in the South region, and 8% was in the West region.[14] At the same time, the nation’s population was about 30% in the Northeast, 35% in the North Central, 30% in the South, and about 5% in the West.[15]
As reflected by Easterlin, income redistribution among the country came at the expense of the North and South regions of the Country.[16] Easterlin also cautions against “equating income changes wholly to changes in economic well-being”.[17] Additionally, population and the percent of individual income do not remain consistent. For example, the North had a decreasing share of the nation’s population, yet individual income percentages remained high in this region relative to other regions.
Returning to the economic issue of the South, postbellum decline in individual income could have many factors. Margo notes, for example, that wages could have been paid in various forms besides dollars, like room and board.[18]Margo also claims that farm wages in the South lagged behind states in the Northeast.[19] Common labor wages in the South also lagged behind those of the Northeast.[20] However, other types of wages in the South, such as carpenters’ wages, outpaced those in the Northeast.[21] Another factor in the South is that agricultural labor production declined.[22]However, in the decades following the Civil War, despite lower general wages in the South, the cost of board in was generally higher in the North than in the South.[23]
In conclusion, population and personal income data help to understand economic growth, but the picture of growth is incomplete without considering other factors such as wages, the cost of living, the labor force, and historical events. The difficulty in assessing post-bellum economic factors is that not every factor discussed was as well documented as it is today. Still, with the information available, one can form quantitative estimates of the U.S. economy’s growth of the for a reasonable comparison.
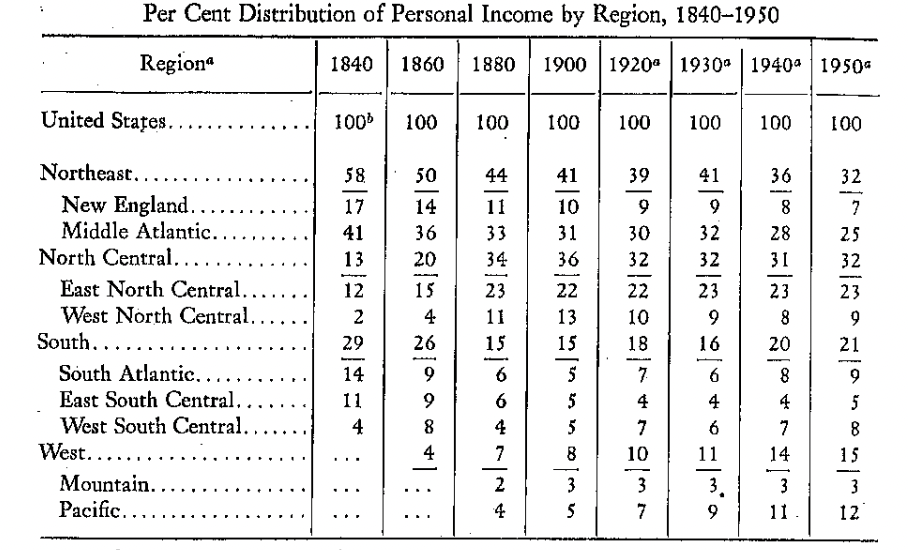
Table 1.[24]
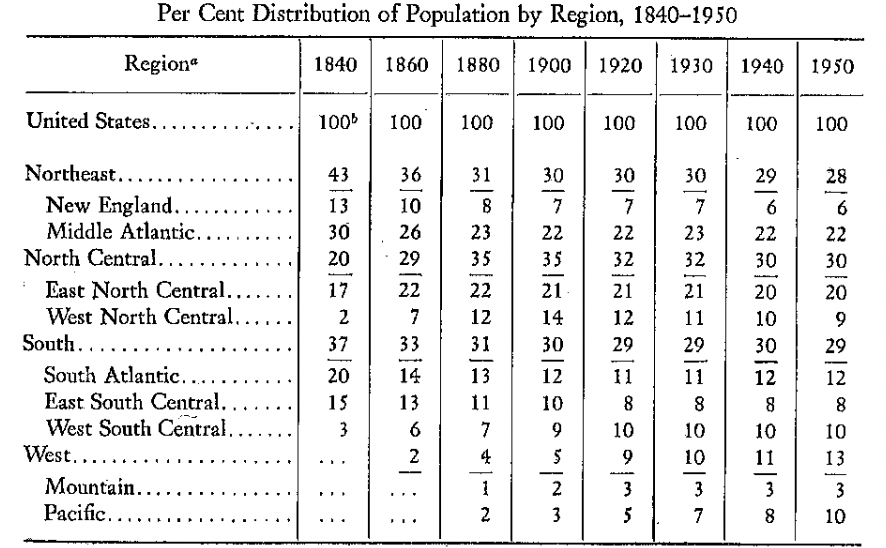
Table 2.[25]
Bibliography
Brady, Demian. Government Spending in Historical Context. Washington, DC: National Taxpayers Union Foundation, 2022. https://www.ntu.org/foundation/detail/government-spending-in-historical-context.
Burton, Vernon. “Economics as Postbellum Southern History.” Old South, New South: Revolutions in the Southern Economy since the Civil War, by Gavin Wright. Reviews in American History 16, no. 2 (1988): 233–40. https://doi.org/10.2307/2702528.
Easterlin, Richard A. “Regional Income Trends, 1840-1950.” In The Reinterpretation of American Economic History, edited by Robert W. Fogell and Stanley L. Engerman, 525-547. New York: Harper & Row, 1971.
Gallman, Robert. “Gross National Product in the United States, 1834-1909.” In Output , Employment, and Productivity in the United States after 1800, edited by Dorothy S. Brady, 3-90. New York: National Bureau of Economic Research, 1966.
Margo, Robert A. “The North-South Wage Gap, Before and After the Civil War.” Cambridge: 2002. https://www.proquest.com/working-papers/north-south-wage-gap-before-after-civil-war/docview/1689579563/se-2.
United States. Bureau of the Census. Long Term Economic Growth, 1860-1965 , October 1966. https://fraser.stlouisfed.org/title/402, accessed on June 8, 2026.
[1] Richard A. Easterlin, “Regional Income Trends, 1840-1950,” In The Reinterpretation of American Economic History, edited by Robert W. Fogell and Stanley L. Engerman (New York: Harper & Row, 1971), 534.
[2] Easterlin, “Regional Income Trends, 1840-1950,” 535.
[3] Easterlin, “Regional Income Trends, 1840-1950.”; Robert A. Margo, “The North-South Wage Gap, Before and After the Civil War”, Cambridge: 2002, https://www.proquest.com/working-papers/north-south-wage-gap-before-after-civil-war/docview/1689579563/se-2.
[4] Vernon Burton, “Economics as Postbellum Southern History,” Old South, New South: Revolutions in the Southern Economy since the Civil War, by Gavin Wright, Reviews in American History 16, no. 2 (1988): 234, 236, https://doi.org/10.2307/2702528.
[5] Easterlin, “Regional Income Trends, 1840-1950,” 535.
[6] Easterlin, 535.
[7] Ibid., 533.
[8] Ibid., 535.
[9] Ibid.
[10] Ibid.
[11] Ibid.
[12] Ibid.
[13] Ibid.
[14] Ibid.
[15] Ibid.
[16] Ibid., 536.
[17] Ibid., 534.
[18] Margo, “The North-South Wage Gap, Before and After the Civil War,” 5, 6.
[19] Margo, “The North-South Wage Gap, Before and After the Civil War,” 3, 9.
[20] Margo, 9, 10, 33.
[21] Ibid., 10.
[22] Ibid., 3, 5.
[23] Ibid., 5.
[24] Easterlin, “Regional Income Trends, 1840-1950,” 535
[25] Ibid.
 jrlhistory
Leave a comment